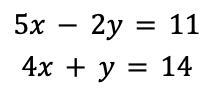
When learning about lines in Algebra 1, you likely learned how to solve a system of (linear) equations, such as the following, by graphing:

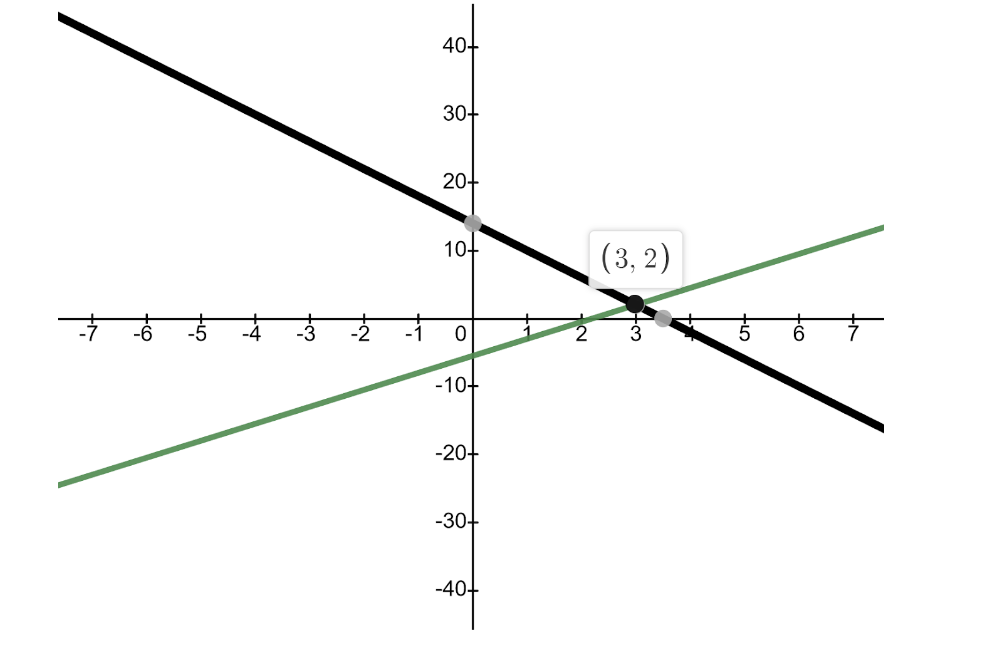
Recall that a point (x,y) is a solution to the system of equations only if plugging it in makes every equation in the system true. To solve by graphing, you graph both of the lines and then find the intersection point:

Thus, the solution to the system of equations above is (3,2). [Don’t just take my word for it- verify it is a solution by plugging it into both equations!]
Finding the intersection on a graph may seem like just a quick trick to solve this one type of problem. But did you know that this method can continue to help you beyond Algebra 1? Here are a few ways how this concept comes up in Algebra 2, Pre-Calculus, and beyond.
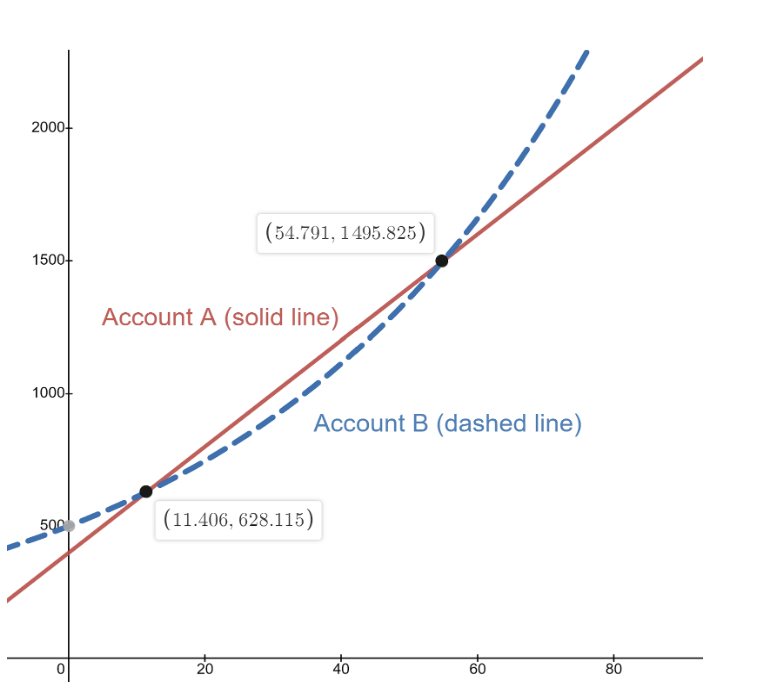
Let’s say you are learning about linear vs. exponential growth in Algebra 2. Suppose you have money in two bank accounts represented by the following equations, with x being the time in months. How could you find out when they will contain the same amount of money?

The bank account problem contains a more complicated system, but our goal is the same- we need to find the solutions! For each solution we find, y will give us how much money is in both accounts after x months. And the easiest way to find the solutions is to graph. If we graph both equations using technology, here is what we get:

The graphs intersect at two points, so both accounts have the same amount of money at two different times! After 11.4 months, both accounts have $628.12. And after 54.8 months, both accounts contain $1495.83.
Note that linear systems typically only have a single solution, but other systems could have zero, one, two, three, or even up to an infinite number of solutions! No matter how many there are, you can find every (real) solution by graphing the equations and finding the intersections.
You can also use this graphing trick even when you only have a single equation (with a single variable). For example, let’s say you need to approximate all the values of x that make the following (ugly) equation true for your Pre-Calculus class:

Just using algebra and brute force won’t work here since there is an “x” both inside and outside of the sine function- so we’ll need to graph! But how can we graph this without a “y=”? It turns out that we can rewrite this equation (of one variable) into a system of equations, where the left-hand side becomes the first equation and the right hand side becomes the second equation:

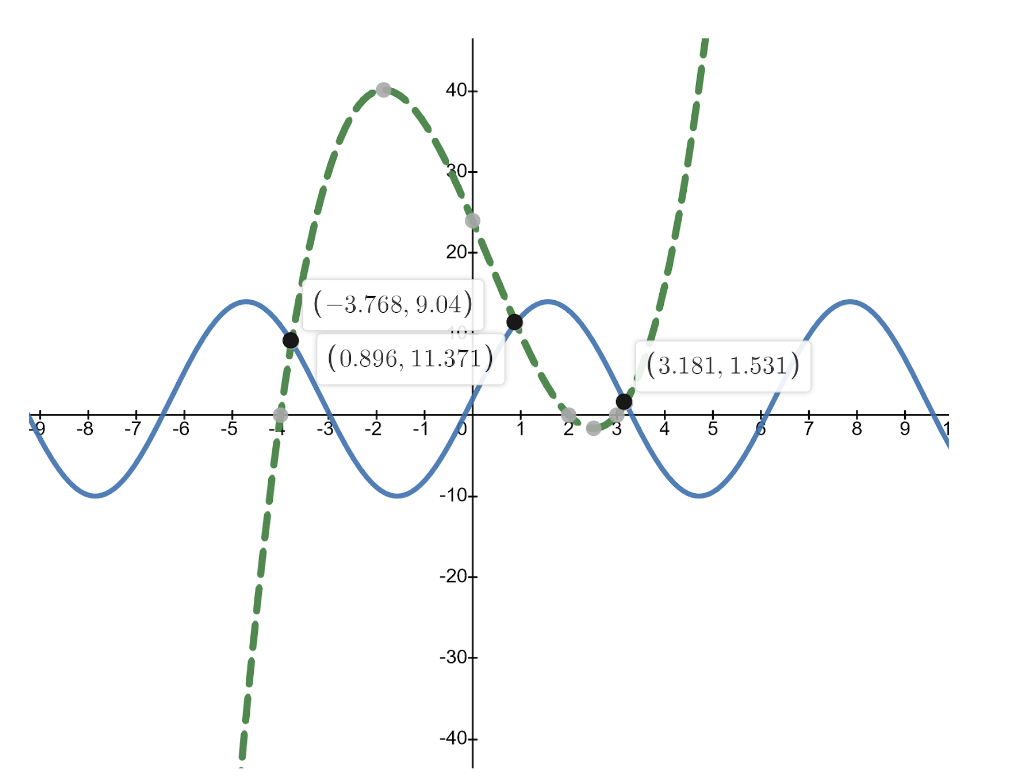
Now, all we have to do is find the x-values of the solutions of this system. Since the y-values in each equation will be equal, that means that our original equation will be true as well! Graphing these two equations gives the following:

Therefore, we can see that there are three solutions: approximately x=-3.768, x=0.896, and x=3.181.
Later, when you get to Calculus, you’ll learn how to find the area between two curves, and the points of intersection (solution) will help you find your lower and upper limits of integration. And in college, you might take a course in Linear Algebra, where you’ll upgrade from solving systems of two linear equations with two variables to solving systems of n linear equations with n variables (where n could be any whole number). It turns out that the solutions to these larger systems are quite important in the computational sciences!
So while you learn how to solve systems of equations by graphing in Algebra 1 using linear equations, don’t let this strategy gather dust afterwards! Keep it close at hand in your mathematical toolbox, and be ready to apply it to other types of equations as well!


Comments