Probability is one of those topics that haunt children from grade school days, asked to determine the likelihood of picking out red marbles from a box. Even my most advanced math tutoring students sometimes feel bamboozled by it. Why? Because probability and statistics can quickly become overwhelming with the many different distributions and definitions. The key is to find the underlying patterns and to stay organized.
Underlying Themes & Definitions
Random Variable
Random variables are the building blocks of probability. A random variable is simply a function that maps a domain into a range that is a subset of the real numbers. Usually you can think of a random variable as something that maps events (the domain) to the probability of their occurrence (numbers).
Random variables can either be discrete or continuous. Different random variables can fall into different distributions. Each distribution describes a different type of event. The best way to remember them is to find a scenario to associate with each type of distribution.
Central Limit Theorem
Once you have these distributions defined and understood, the Central Limit Theorem is central to all of statistics, as it allows approximations of many distributions by the normal distribution. Questions will fall into a general format of statistical hypothesis testing:
- Null Hypothesis: assumes no difference or no effect; Alternative Hypothesis: assumes the effect exists. The goal is to see which is more probable.
- Set a threshold, which is the significance level, a.
- Find a p-value: this is the probability of getting the observed or more extreme data, assuming the null hypothesis is true.
- If the p-value, the probability of that occurring, is less than the significance level, then you reject the null hypothesis and accept the alternative hypothesis. Vice versa, if the p-value is not less than the significance level.
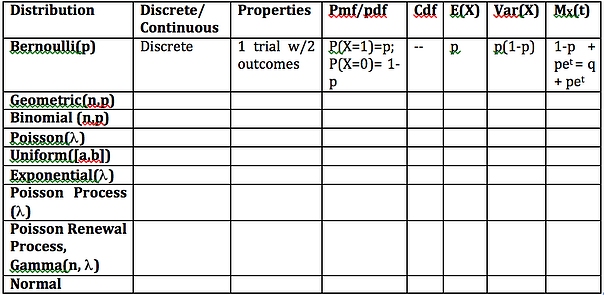
DistributioNS
The best way to stay organized is to begin with a table for the distributions and fill in the properties as you go through the semester. Keeping a table throughout the semester will be helpful as a quick reference when doing assignments and will consolidate a lot of information come the midterm and final exam. For example, the following is a sample chart that you can modify and expand as needed:
The key to probability and statistics is to stay organized and to constantly remember to see the forest for the trees. Just like all math classes, you’ll be learning another piece of the language; staying on top of definitions is key. However, more importantly, try not to think about each topic in isolation, but discern the similarities. The table above picks out only some of the patterns that you will be seeing. If organizing information this way helps you, continue to make more tables to help you elucidate the underlying themes. Seeing what you’re learning as iterations of more basic concepts will help make things more “bite-sized” and slightly less overwhelming.
Comments