Have you just started your investment journey and wondered how much to invest? Did you follow promising strategies but still see your account in red? Are you worried about the risk that you cannot foresee in your holdings? If you are nodding along these questions, know that you are not alone. In fact, these are what professionals like quants, traders, and asset managers wonder but fail to solve all the time- one often enters the market with a correct timing at a correct price but walks out with a flat wallet, and worse off, with margin debt. An example was when Ray Dalio’s hedge fund, Bridgewater Associates, lost 12.1billion of investor’s money during the post-COVID19 recovery in 2020. According to the U.S. Securities and Exchange Commission (SEC), 70% of investments are lost to mistreated risks. These risks are often inevitable, yet identifiable with the right statistics techniques. An example using Apple’s stock return is used to illustrate this.
Plotting a Histogram
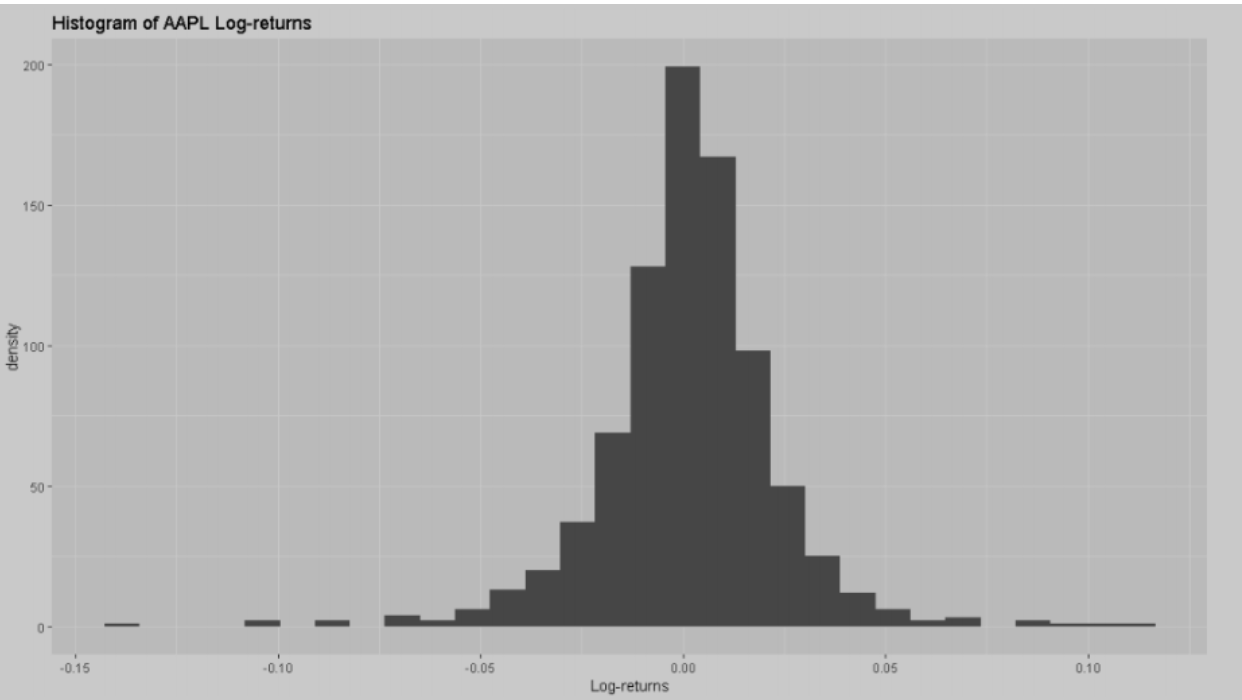
Daily stock returns of Apple from January 1st, 2018 to May 21st, 2021 are put on a log-scale for the sake of normalization, and a histogram is plotted to show their distribution. The log-returns seem to range from -0.14 to 0.14, and peak around 0. The distribution seems to be symmetric with moderate spreads on both sides.
Fitting Probability Distribution Models
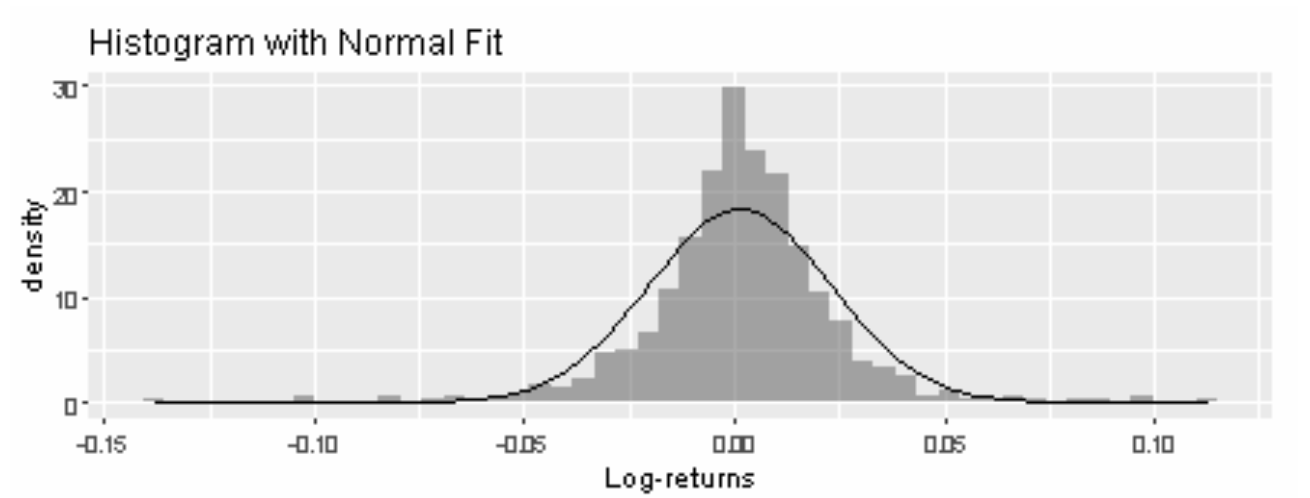
Our goal is to find the distribution curve that best fits the histogram. In the graphs below, a Normal Distribution and a Generalized Error Distribution (GED) are fitted. Which distribution curve helps achieve our goal better?
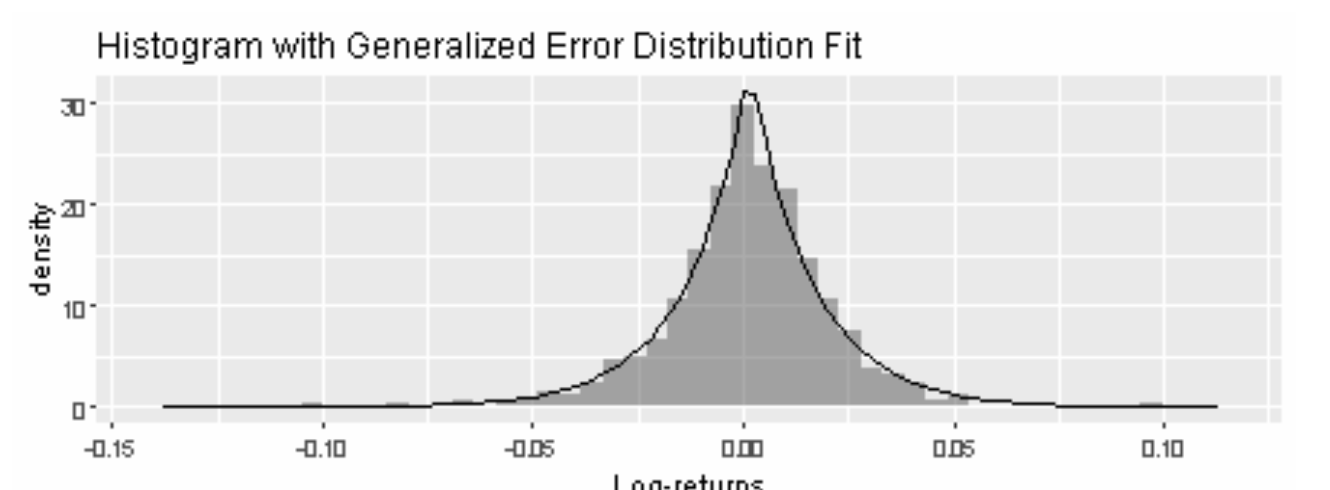
Observantly, one could see that the GED curve fits the histogram better because its line traces the density bars closer throughout all log-return values, particularly at the center of the histogram, when the Normal Distribution curve fails to capture the peak of the histogram.
Having found such a curve means that we have obtained a model function that can simulate Apple’s log-return for the next day, the day after, and so on. For example, according to the GED model, there is around a 7.5% probability that Apple’s investors will have a log-return of either -0.02 or 0.025 on the next trading day.
Finding Value-at-Risk (VaR) and Expected Shortfall (ES)
VaR is a statistic used to quantify the risk of potential losses for a firm or an investment. ES is a statistic used to quantify the average losses for a firm or an investment given the loss is at least the VaR level. Both statistics are widely used by institutions like commercial banks and hedge funds to evaluate market risk and portfolio losses. An example is for a mortgage company to estimate the probability a user defaults on a loan.
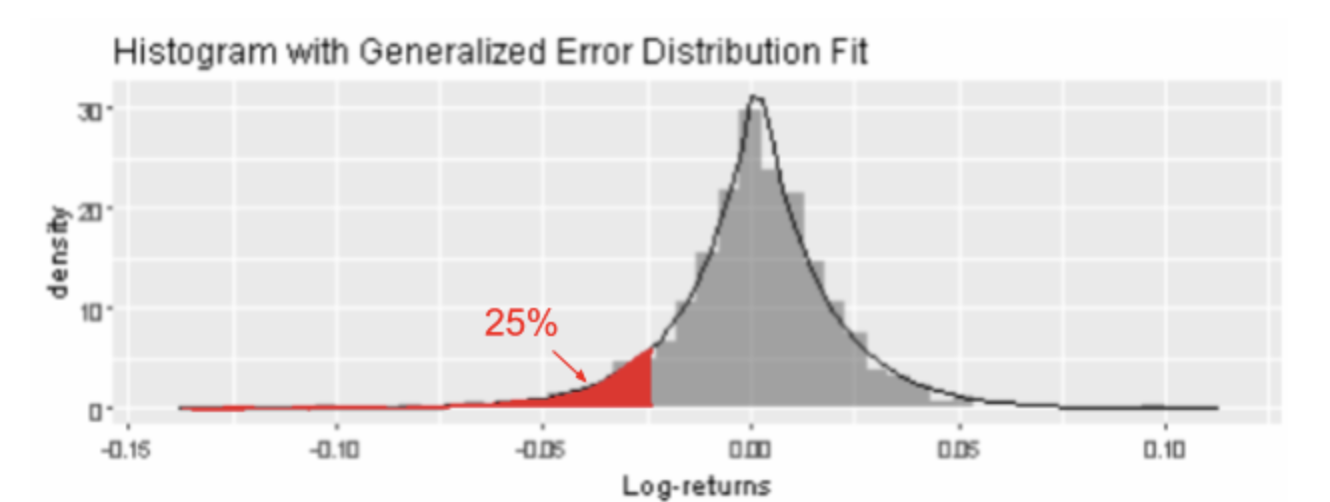
To find VaR, we first specify a probability, also known as a risk level (red area), then find the quantile up to which the probability covers from the left tail of the distribution. For example, using the GED curve selected above, we can conclude there is a 25% probability that an investment in Apple will incur a loss of at least 2.5% (-0.025 log-return). Apple’s ES is the average amount at risk, given that its risk exposure is at least 2.5%. This amount may be computed via Monte Carlo simulation, which we will not do here.
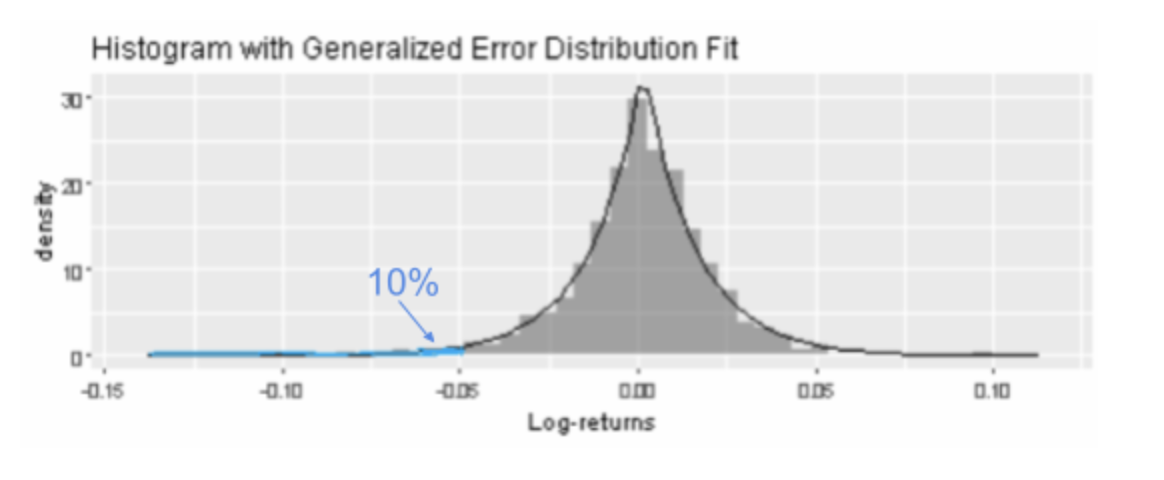
Question: After reading Apple’s chart, an investor believes that the company is fundamentally healthy and holds a $25000 position.Using the GED model, what is the probability for this investor to lose at least $1250? (Assume that log-returns represents returns on a 1:1 scale)
Answer: Since $1250 is equivalent to $1250/$25000=5% of the investor’s position in Apple, according to the GED curve above, the probability for the investor to lose at least 5% of his position is represented by the blue shaded area.The exact area can be determined through integration or algorithmic computation, which turns out to be 10%.
Sources
https://www.investopedia.com/terms/v/var.asp
Comments