We’ve already covered a little bit about the basics of enzyme kinetics, so now let’s move on to discuss an important application of enzyme kinetics in the body (and in medicine)...
Enzyme inhibition
Enzymes are not always “on” and working; occasionally they are working on overdrive. Like all things in life, the key to healthy functioning is balance. Many drugs work to either block or enhance enzymatic function. In 1934, Hans Lineweaver and Dean Burk took a look at the Michaelis-Menten equation and rearranged it into a nice graphical form that’s easy and intuitive to interpret.
Important formulas for enzyme inhibition
They started with the Michaelis-Menten equation:

Remember that Km reflects the enzyme’s dissociation constant. A high Km means weak binding (the enzyme likes to dissociate from its substrate), and a low Km means strong binding (it doesn’t like to dissociate from its substrate, meaning that it has a strong affinity for the substrate).
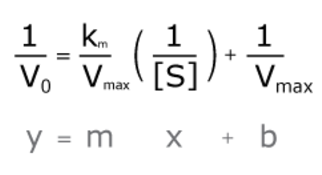
Then, they rearranged the variables so that we could graph their relationship in a line, using our familiar y = mx + b equation.

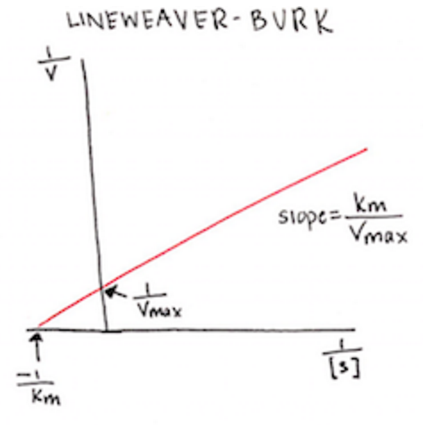
Looking at these variables, we can see that the slope of the reaction curve is equal to Km/Vmax, and the y-intercept is equal to 1/Vmax. Something that’s harder to know just by looking at this equation is that the x-intercept is equal to -1/Km.

Types of enzyme inhibition
Usually, when we are talking about manipulating enzymatic function, we are talking about inhibiting enzymes, and we are doing so in a reversible way. This means that the enzyme is manipulated in such a way that it can return to its normal function. Within reversible inhibition, we have competitive and noncompetitive (allosteric) inhibition.
1. Competitive inhibition: the added molecule competes with the enzyme’s normal substrate for access to the enzyme’s binding site.
By physically occupying the active binding site, the molecule blocks the enzyme’s normal interaction with its substrate, thereby slowing the overall reaction velocity. Essentially, you are temporarily “knocking out” enzymes that could be doing work for you, but can’t because they’re busying binding to a molecule that doesn’t produce your final product of interest. Once the competitive inhibitor dissociates from the enzyme’s binding site, that enzyme is free to interact with either its regular substrate or with another molecule of the inhibitor.
Usually, competitive inhibitors are designed to have a higher affinity for the molecule than for the normal substrate, meaning that it “likes” the inhibitor more. Remember, whether the enzyme and the inhibitor bump into each other in the first place is completely a function of chance. That’s why you want to use competitive inhibitors in high volumes so that there is a greater chance that they will bump into your enzyme’s binding site and block the normal substrate from binding to this binding site.
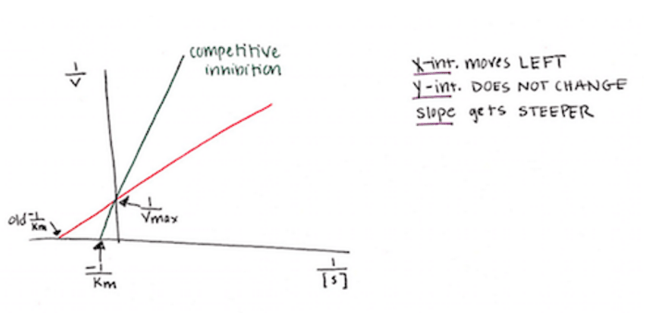
If your enzyme of choice is busy interacting with the competitive inhibitor instead of with its normal substrate, then the normal substrate changes- the APPARENT Km increases. This means that the enzyme has a LOWER affinity for it. How does this affect our Lineweaver-Burk plot? If the Km goes UP, then the denominator of the y-intercept (-1/Km) increases. This means that the x-intercept has a smaller absolute value, and shifts to the RIGHT, closer to zero. However, your Vmax stays the same (even though it may be harder to reach with all that competitive inhibitor floating around). So the net result is a steeper slope of your line.

2. Non-competitive (allosteric) inhibition: the added molecule does not bind in the enzyme’s active site, and therefore is not competing directly for that site with the enzyme’s natural substrate.
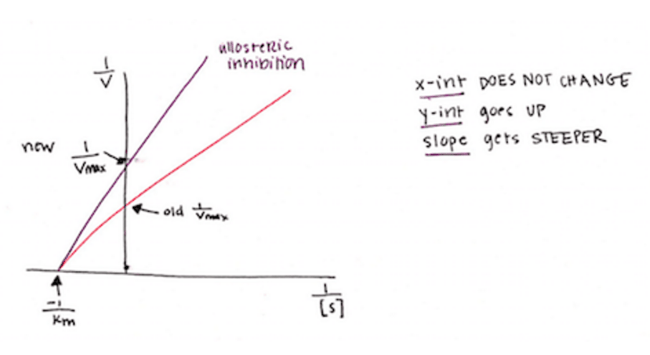
Instead, the allosteric inhibitor is binding to another site on the enzyme that, when bound, changes the entire enzyme’s shape JUST enough that its active site is no longer the right shape to bind to its natural substrate. Therefore, there is no change in your Km because there is no change in binding affinity at the active site. However, fewer active sites are available, so your reaction velocity decreases. When Vmax decreases, the y-intercept (1/Vmax) increases. The result is that the slope of your line increases, but your x-intercept does not change – the line looks like it pivots upward.

How will this appear on the MCAT?
These types of graphs may be included as part of a passage to show the effects of enzyme inhibitors in an experiment. Or, a question might ask you which graph represents the effect of a reversible competitive inhibitor on enzyme kinetics. More importantly, understanding these graphs will help you intuitively understand and remember concepts central to enzyme inhibition.
Let’s review:
Competitive inhibition:
- x-intercept moves left, closer to zero
- y-intercept does not move
- slope gets steeper
Allosteric inhibition
- x-intercept does not move
- y-intercept gets bigger, away from zero
- slope gets steeper

Comments