The central limit theorem (CLT for short) is an enormously powerful tool that makes much of what we do in statistics possible. But if you just read the actual definition, which you can find below, it’s pretty hard to understand why this theorem is so important. This blog post will help you understand both what the CLT is and why it is important for statistical inference.
“The central limit theorem states that if you have a population with mean μ and standard deviation σ and take sufficiently large random samples from the population with replacement, then the distribution of the sample means will be approximately normally distributed.”
Taking a step back
First, let’s take a step back and imagine a variable that is normally distributed in the population of interest. (If you need a refresher on what this means, check out our blog post on the normal distribution here.) Let’s use the example of height (a variable) for men in the United States (the population of interest).
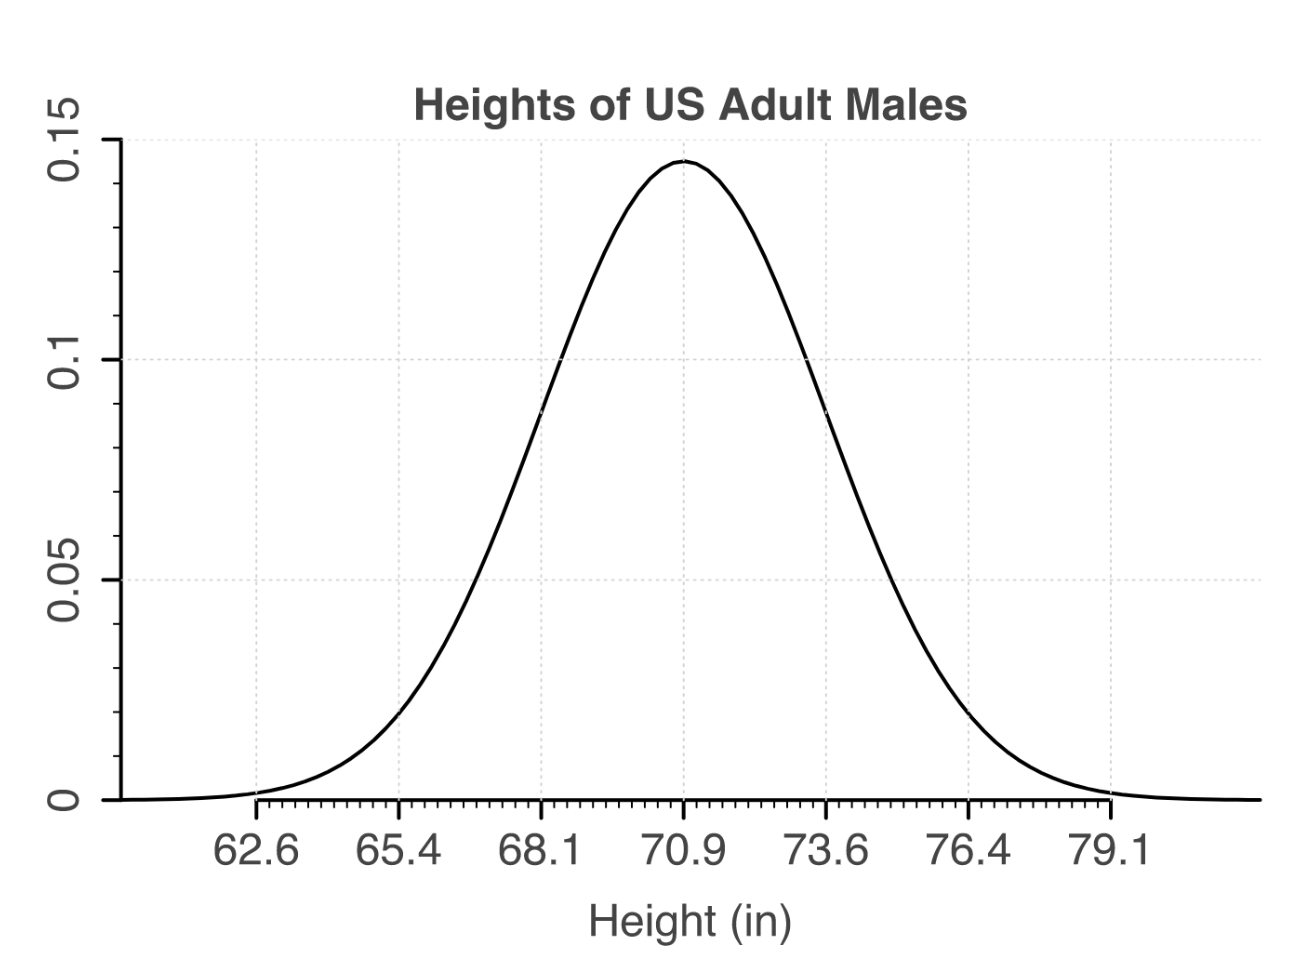
We can see here that the mean height for men in the U.S. is 70.9 inches, which is calculated by collecting the heights for every single man in the U.S. and then calculating the mean. This value is called the population mean.
But you can imagine that it’s really hard, probably pretty much impossible, to collect the heights for every single man in the U.S. This means that it’s impossible for us to know the true population mean (AKA the true mean of the heights of all the men in the U.S.). So what do we do?
Taking samples
Because it’s impossible to know the population mean, what we do in statistics is try to gather enough information to let us make good guesses about what the population mean is. In other words, we try to approximate the population mean as best we can with the information we have.
To gather this information, we need to take random samples that are representative of the population. This means we can find a random group of men who are representative of men in the U.S. and find out what their heights are, and then calculate the mean. This value is called the sample mean.
But what would happen if we take a sample, calculate the sample mean, and then just use that as our approximation for the population mean? The problem with this approach is that because the samples we take are random, if you take 100 different samples, you will probably get numerous different sample means. This means there’s no way to know if one sample you took is actually a good approximation of the population mean.
For example, imagine you take a sample of 100 random men in the U.S. and find that the sample mean of their heights is 65 inches. But then imagine you take another sample of 100 different random men in the U.S. and find a sample mean of 75 inches. The differences in random samples that you take are called sampling fluctuations and they are the reason you can’t just assume the population mean based on a single sample mean.
Enter: the central limit theorem
Now imagine that instead of taking one sample of 100 random men in the U.S., you take 100 such samples. Each of these samples will have its own sample mean, which means we will have 100 total sample means.
From there, imagine if you plotted a histogram with each of these sample means. Remember that each sample mean is just a number, so you can plot it just like you would with the heights of individuals. The distribution of all 100 sample means is called the sampling distribution. The question is, what would this distribution look like?
This is where the central limit theorem finally kicks in. According to the definition we saw above, the central limit theorem states that the distribution of these sample means (AKA the sampling distribution) will be approximately normal. This means that if we plot the 100 sample means we calculated in a histogram, the distribution of the sample means will be approximately normal.
Putting it all together
To understand why all of this is important, remember the problem I laid out at the start: because we can’t measure the population mean directly, we need a way to approximate it. But we also can’t just take one sample, calculate the mean, and assume that is the population mean. Now the central limit theorem tells us that if we take multiple samples, the means of those samples will be distributed approximately normally.
The crucial consequence of this is that the mean of the sampling distribution approximates the population mean. In other words, the CLT tells us that as the sample size of each sample increases—i.e. if we took multiple samples of 1,000 men instead of just 100—the mean of the sampling distribution continues to approach the population mean. Here is a step-by-step run-through of the logic:
- Take multiple random samples of your population of interest (and it turns out the sample size for each samples needs to be at least 30, so in this case you would need to take multiple samples of the heights of at least 30 men)
- Calculate the mean for each sample and plot them to get the sampling distribution (which will be normally distributed)
- Calculate the mean of the sampling distribution
- Then, the CLT tells us that the mean of the sampling distribution is a good approximation of the population mean, and gets closer to it as the size of each of your samples increases
In this way, the CLT helps us approximate the population mean even when we can’t directly measure it by allowing us to make conclusions based on the samples we can directly measure. That is why the CLT is crucial for many of the inferences that underlie the practice of statistics.
Sources
https://sphweb.bumc.bu.edu/otlt/mph-modules/bs/bs704_probability/BS704_Probability12.html
http://www.math.iup.edu/~clamb/class/math217/3_1-normal-distribution/


Comments